
Reports and dashboards
Reports answer questions about your work: where the time went, whether a sprint is on track, which milestones slipped, who is overloaded. Dashboards put the answers you check often on one page. This page explains each report, what it is for, and how to open, share and export it.
Reports are being reworked
The report screens are changing. This page describes what each report is for and the main steps, not every button. Names may differ slightly from what you see.
Where reports live
| Place | What is there |
|---|---|
| Dash in the left bar | Your dashboards |
| Time in the left bar | Timesheet reports: project time, workload and tracker recordings |
| More, Reports group | Milestone Report, Variance Report, Custom Report and Capacity Planning |
| A project's Reports | Sprint, velocity and milestone reports for that project, plus portfolio, variance and custom tabs |
| More, Work, Portfolio | Several projects at once |
What you see depends on your role and your plan. A report you may not open is not shown in the menu. Reports only ever count work in projects you can open.
Dashboards
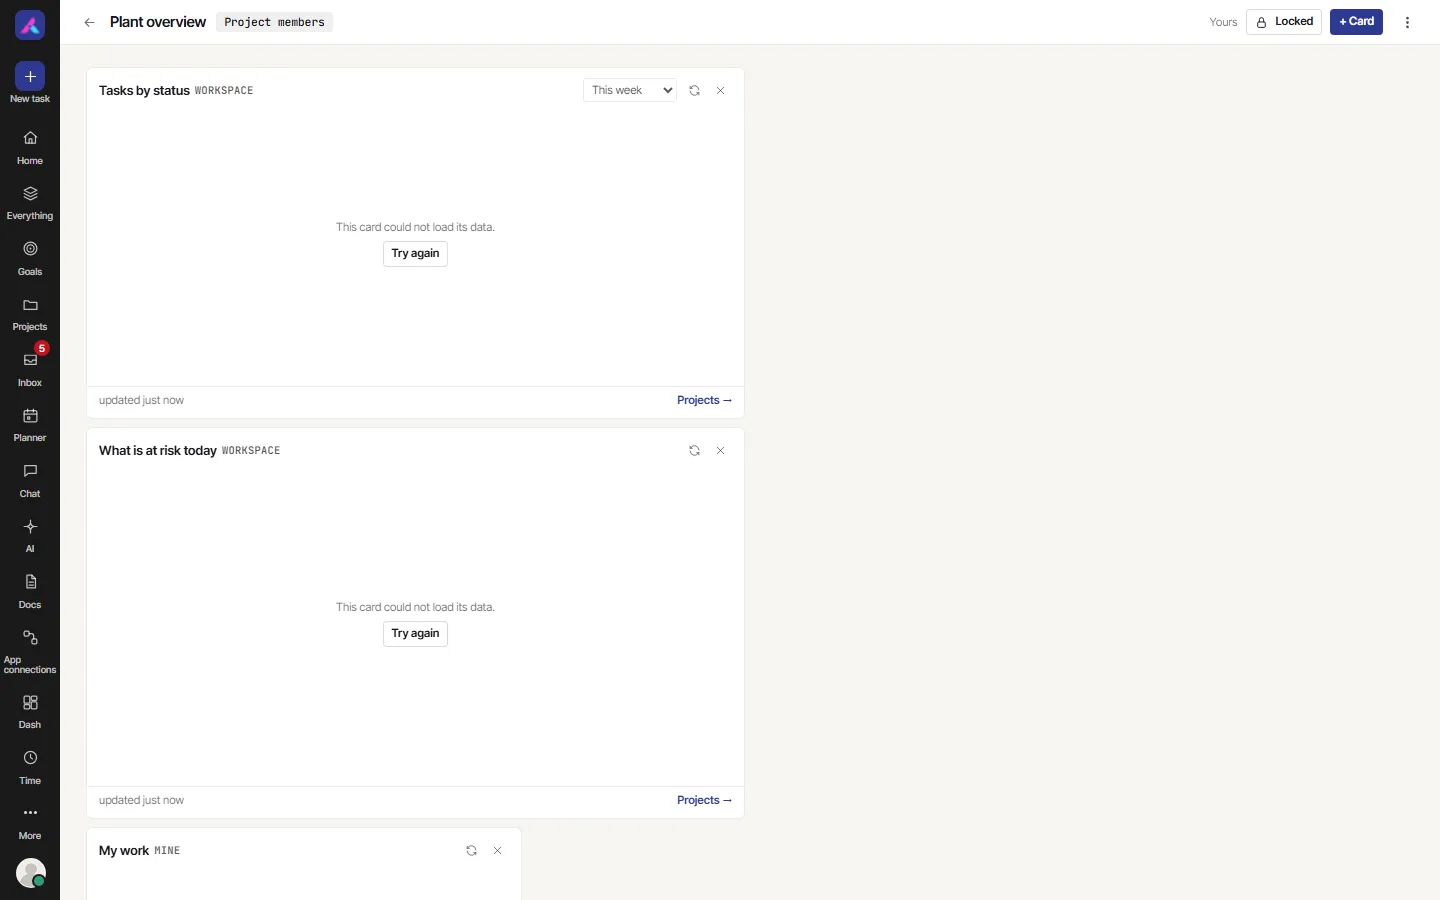
A dashboard is a page of cards. Each card answers one question, such as "what is due this week?" or "how many tasks are in each status?", and opens the view behind it when you select it.
Make a dashboard
- Select Dash in the left bar.
- Select + Dashboard.
- Give it a Name, such as "Leadership weekly".
- Choose Who can see it: Only me, Everyone in the workspace, or Project members of a project you pick.
- Under Start with, pick a template:
- Empty: add cards yourself.
- My work: what is due, and your hours against your plan.
- Team overview: project pulse, tasks by status, logged against estimate, and free capacity.
- Select Create.
Add and arrange cards
- Select + Card to open the card picker. Cards are grouped by the question they answer: My work, Team and project, Charts and tables, and AI. Search to find one, then select Add.
- Each card has its own settings, such as which project it covers.
- Locked stops the layout being changed by accident. Unlock it to move or remove cards.
- Use Dashboard settings to rename it or change who can see it.
The All dashboards list has tabs for All, Mine and Shared with me. From a dashboard's More menu you can Open, Duplicate or Delete it.
Good to know:
- A card the viewer may not see shows nothing, instead of an error. A shared dashboard never reveals work someone could not open.
- When you duplicate a dashboard, its cards keep their project filters.
- AI cards need AI to be on in your workspace.
Timesheet reports
Open Time in the left bar. Besides your own week, your role may give you:
| Report | What it answers |
|---|---|
| Project time | How many hours went into each project, by person and by day |
| Workload | How busy each person is against their capacity, including time off |
| Tracker | The desktop tracker's recordings and screenshots |
Each screen has a role setting of Own or Everyone. With Own you see only your own time. Owners and admins see everyone. See Time and timesheets.
To take the numbers elsewhere, use Export on the timesheet. It downloads a CSV with the user, project, date, description, billable flag and hours. For a workload chart inside a project, see the Workload view.
Project reports
Open a project and choose Reports. The tabs depend on how the project works:
| Tab | What it shows |
|---|---|
| Sprint | A sprint's burndown (by story points or task count), what was finished and what carried over, and retro notes |
| Velocity | Work finished per sprint over time, and a cumulative flow diagram that shows where work piles up |
| Milestones | Each dated milestone, whether it is on time, slipped or signed off, and who moved its date |
| Portfolio, Variance, Custom | The workspace reports below, opened from the project |
Sprint and velocity reports have Export PDF.
Milestone report
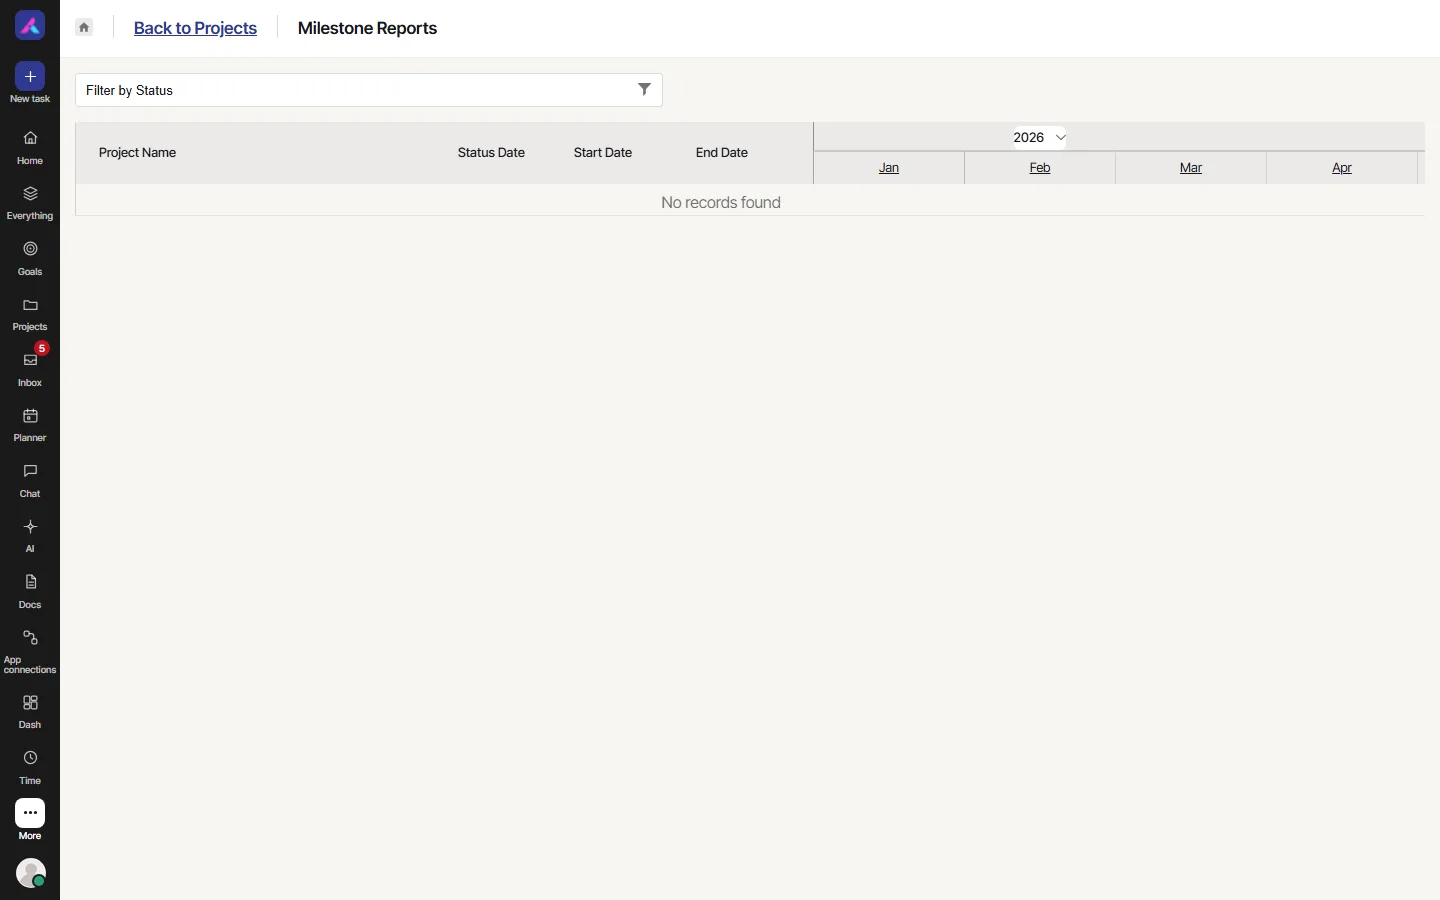
Milestone Report lists milestones across projects with their dates and state. It answers "which deliveries are late?". Slip is measured against the first date recorded for the milestone, and every date change is in the activity log with who moved it. A milestone appears once it has a due or end date. See Milestones.
Your role needs the milestone report permission to see it.
Variance report
Variance Report compares estimated hours with hours actually logged, by project, by person or by team. It answers "where did we go over?". Tasks need estimates for this to mean anything.
Capacity planning
Capacity Planning shows each person's or team's committed hours against the hours they have available, after time off. It answers "who can take more work?". Set your own working hours and capacity in Your settings.
Custom reports
Custom Report is a report builder for questions the other reports do not answer.
- Open More, then Custom Report, and select New report, or Start from a template.
- Choose a Source: Tasks or Time logs.
- Add filters, such as a date range (from the last month up to the last 12 months) or billable only.
- Choose Group by: status, project, list, person or month.
- Choose a Measure: task count, story points, hours logged, entries or billable amount.
- Choose a Chart: table, bars, line or pie. The preview updates as you go. Select a group to narrow to it.
- Name the report and select Save.
Once saved, Schedule email sends it to a list of email addresses daily, weekly or monthly. Email must be set up on your server for this to work.
The builder needs a wide screen. On a phone it asks you to open it on a desktop.
Portfolio
Portfolio rolls several projects up into one view, so leaders can see progress and risk across them. If your server has an AI provider, a written Portfolio digest sums it up; without one, the figures are the whole picture.
Export and share
| Want to | How |
|---|---|
| Share a live view of a report | Put it on a dashboard and share the dashboard with the workspace or project members |
| Send a report on a schedule | Save a custom report, then Schedule email |
| Hand numbers to finance | Export a CSV from the timesheet |
| Print or attach a sprint report | Export PDF |
| Export a whole workspace | Settings, Import & export (owners and admins) |